-
The static and dynamic properties of a nucleus predominantly dictate its shape or structure, and these properties depend on the interactions among its constituents, i.e, protons and neutrons. Most nuclei exhibit an axially symmetric, dominantly quadrupole, deformed shape in the ground state. However, there are several regions, known as transitional regions, in the nuclear chart where axial symmetry is not conserved; the triaxial mean-field approximation may be used to characterize the properties of these nuclei. Nuclei in the transitional region
$ Z\geqslant 50 $ and$ N\leqslant 82 $ are characterized by softness to the$ \gamma $ -deformation [1], which accounts for shape coexistence in these nuclei [2]. In these nuclei, protons in the valence shell begin to fill the$ h_{11/2} $ shell, while the neutrons remain in the middle of that shell. Rotational alignment of these valence protons and neutrons trend to drive the nucleus towards prolate and oblate shapes, respectively [3]. Therefore, the nuclei lying in the above referred transitional region are good candidates for the study of various interesting phenomena, such as the effect of orbitals on deformation, investigation of shape changes, new excitations with regard to triaxial deformations, etc.In the past few decades, the use of improved and sophisticated experimental techniques has made it possible to provide sufficient data to describe the structure of nuclei in various mass regions of the nuclear chart. In particular, the transitional nuclei around mass
$ A\sim 130 $ have numerous interesting features, such as odd-even staggering (OES) in the gamma band at low spins, triaxial deformation, etc. [4–6]. The even-even nuclei close to the proton shell closure at Z = 50 have been the subject of numerous theoretical [7–15] and experimental studies [16] in the past. The Xenon (Z = 54) nucleus with four protons more outside the 50-proton closed shell is positioned in the transitional region of nuclear chart, where nuclear structure varies from a spherical nature to a deformed one. Thus, this region is observed to be rich in the nuclear structure, as it provides a testing ground to probe the interplay between triaxial and axially deformed nuclear shapes. This region is an exciting field in nuclear-structure studies because of the reported presence of low-lying intruder states, as well as the occurrence of a triaxial shape. Hence, the present study attempts a theoretical investigation of a chain of even-even Xe nuclei within the application of the TPSM approach. In recent times, as well as in the past few decades, various theoretical studies had been used to investigate various nuclear structure properties, such as energy levels, electric quadrupole moments, and B(E2) of the Xe nuclei [14, 17–21]. These studies suggest that these nuclei are soft with regard to the$ \gamma $ -deformation with a almost maximum effective triaxiality of$ \gamma $ =$ 30^{\circ} $ [7]. Nuclei above the closed shell at Z = 50 and with a neutron number close to the N = 66 midshell exhibit large ground-state deformations, with$ \beta_2\approx $ 0.2–0.3 [22, 23]. For the Z = 54 Xenon isotopes, the ground state deformation is at its maximum for$ ^{120}{\rm Xe}_{66} $ , which is evident from the minimum value of excitation energy of the first$ 2^+ $ state$ [E(2_{1}^{+})] $ . Below$ ^{120} {\rm{Xe}}$ , the values of$ [E(2_{1}^{+})] $ increase down to the lightest known isotope$ ^{114} {\rm{Xe}}$ , indicating a decrease in the deformation as the N = 50 closed shell is approached. This trend is quantitatively supported by calculations presented in Ref. [24], which predict that the tendency continues all the way to the closed shell. Furthermore,$ ^{120} {\rm{Xe}}$ is a well-studied nucleus [25, 26] with a ground state rotational band$ (E_{4+}/E_{2+}\approx2.5 $ ) and a quasi-band with a band head at 876.0 keV. Furthermore,$ ^{120} {\rm{Xe}}$ lies in a complex nuclear transition region, which evolves from a vibration-like structure near N = 82, through a$ \gamma $ -soft region near N = 74, towards rotational configurations for lighter neutron-deficient nuclei. In the N = 66 region,$ ^{120} {\rm{Xe}}$ is the heaviest even-even nucleus showing a signature of shape coexistence [27]. Moreover, quasi-ground-state bands and quasi-rotational$ \gamma $ -vibrational bands with unstable$ \gamma $ -deformations have also been studied for Xe in this nuclear region [28].The Xenon nucleus thus belongs to the region of the nuclear segre chart where the effect of triaxiality on the nuclear structure is evident. Therefore, the purpose of the present study is to investigate the observed band structures and, in particular, the observed triaxiality in
$ ^{118-128} {\rm{Xe}}$ isotopes using the triaxial projected shell model (TPSM) approach [29, 30] in a simple and comprehensive manner. The formalism of the TPSM that we are using in the present study has been successfully employed in the past [31–33] to study high-spin structures of triaxially deformed nuclei. Further, the present chain of isotopes$ ^{118-128} {\rm{Xe}}$ has not been studied to date with the application of TPSM; therefore the present work was taken up as a challenge to describe their structure within TPSM.The paper is organized as follows. Section 2 provides a brief overview of the theoretical approach (TPSM) used in the present work. The results of the measurement for the Xenon isotopes, followed by a discussion and their comparison with the available experimental data, are presented in Section 3. Finally, the study is summarized in Section 4.
-
In the present study, the three-dimensional angular momentum projection technique was successfully adopted to study the
$ \gamma $ -vibrational band structures in triaxially deformed nuclei. The TPSM approach has also provided theoretical support for observation of the$ \gamma\gamma$ -band in those nuclei [33]. Because the studied$ ^{118-128} {\rm{Xe}}$ isotopes are of the even-even type with even protons and neutrons, the TPSM basis chosen for carrying out the present study is composed of the projected 0-qp state (or qp-vacuum), two-proton qp, two-neutron qp, and 4-qp configurations, namely,$ \begin{array}{*{20}{r}} {{\hat P}_{MK}^I | \Phi > ,}\\ {\;\;{\hat P}_{MK}^I\;a_{{p_1}}^{\dagger } a_{{p_2}}^{\dagger } | \Phi > ,}\\ {\;\;{\hat P}_{MK}^I\;a_{{n_1}}^{\dagger } a_{{n_2}}^{\dagger } | \Phi > ,}\\ {\;\;{\hat P}_{MK}^I\;a_{{p_1}}^{\dagger } a_{{p_2}}^{\dagger } a_{{n_1}}^{\dagger } a_{{n_2}}^{\dagger } | \Phi > ,} \end{array} $

(1) where
$ |\,\Phi\!> $ represents the triaxial vacuum state. The three-dimensional angular-momentum projection operator [34] is given by$ {\hat P}^I_{MK} = {2I+1 \over 8\pi^2} \int {\rm d}\Omega\, D^{I}_{MK}(\Omega)\, {\hat R}(\Omega), $

(2) with the rotational operator
$ {\hat R}(\Omega) = {\rm e}^{-\imath \alpha \hat J_z} {\rm e}^{-\imath \beta \hat J_y} {\rm e}^{-\imath \gamma \hat J_z}, $

(3) $ \Omega $ denotes a set of Euler angles ($ \alpha, \gamma $ = [0,$ 2\pi $ ],$ \beta $ = [0,$ \pi $ ]) and J denotes angular-momentum operators. In this present approach, triaxiality is included in the deformed basis, which helps perform an exact three-dimensional angular momentum projection. In this manner, the deformed vacuum state obtained is significantly improved, as it permits all possible components of K. The projected shell model version employed for the description of axially deformed nuclei uses the pairing plus quadrupole-quadrupole Hamiltonian [35] with a quadrupole-pairing term also included, as follows:$ {\hat H} = {\hat H}_0 - {1 \over 2} \chi \sum\limits_\mu \hat Q^{\dagger }_\mu \hat Q^{}_\mu - G_M {\hat P}^{\dagger } {\hat P} - G_Q \sum\limits_\mu {\hat P}^{\dagger }_\mu{\hat P}^{}_\mu , $

(4) and the equivalent triaxial Nilsson mean-field Hamiltonian is given by
$ {\hat H}_N = {\hat H}_0 - {2 \over 3}\hbar\omega\left\{\epsilon\hat Q_0 +\epsilon'{{\hat Q_{+2}+\hat Q_{-2}}\over\sqrt{2}}\right\}, $

(5) where the first term in Eq. (4) is the single-particle spherical Hamiltonian, which has a proper spin-orbit force represented by Nilsson parameters [36]. The force strength quadrupole-quadrupole (QQ)
$ \chi $ is determined in such a way that it holds a self-consistent relation with the quadrupole deformation. In Eq. (5),$ \epsilon $ and$ \epsilon' $ specify the deformation parameters corresponding to the axial and triaxial deformation, respectively, and they are related to the triaxiality parameter by$ \gamma $ =$ \tan^{-1} $ ($ \frac{\epsilon'}{\epsilon}) $ . The calculations were performed with deformation parameters displayed in Table 1. The pairing strength, i.e, monopole pairing strength ($ G_M $ ), is adjusted to obtain the known energy gaps:Xe $\epsilon$ 

$\epsilon'$ 

$\gamma$ 

118 0.215 0.162 37° 120 0.228 0.158 35° 122 0.217 0.1250 30° 124 0.210 0.135 33° 126 0.158 0.113 35° 128 0.145 0.113 38° Table 1. Axial deformation parameter
$\epsilon$ and triaxial deformation parameter$\epsilon'$ , employed in calculation for 118-128Xe. The$\gamma$ deformation is related to the two parameters through$\gamma$ =$\tan^{-1}$ ($\frac{\epsilon'}{\epsilon})$ .$ G_M = \left( G_1 \mp G_2 \frac{N-Z}{A}\right)\frac{1}{A} (\rm MeV), $

(6) with the '–' sign is for neutrons and the '+' sign for protons. The present study on
$ ^{118-128} {\rm{Xe}}$ isotopes was performed with both neutron and proton major shells numbers N = 3, 4, and 5 and with pairing strengths$ G_1 $ = 21.24 and$ G_2 $ = 13.86. The quadrupole pairing strength$ G_Q $ is assumed to be proportional to$ G_M $ , with the proportionality constant set to 0.18 for all isotopes considered in this study. These calculations were conducted with the same set of input parameters for all isotopes under consideration. -
Calculations were carried out for
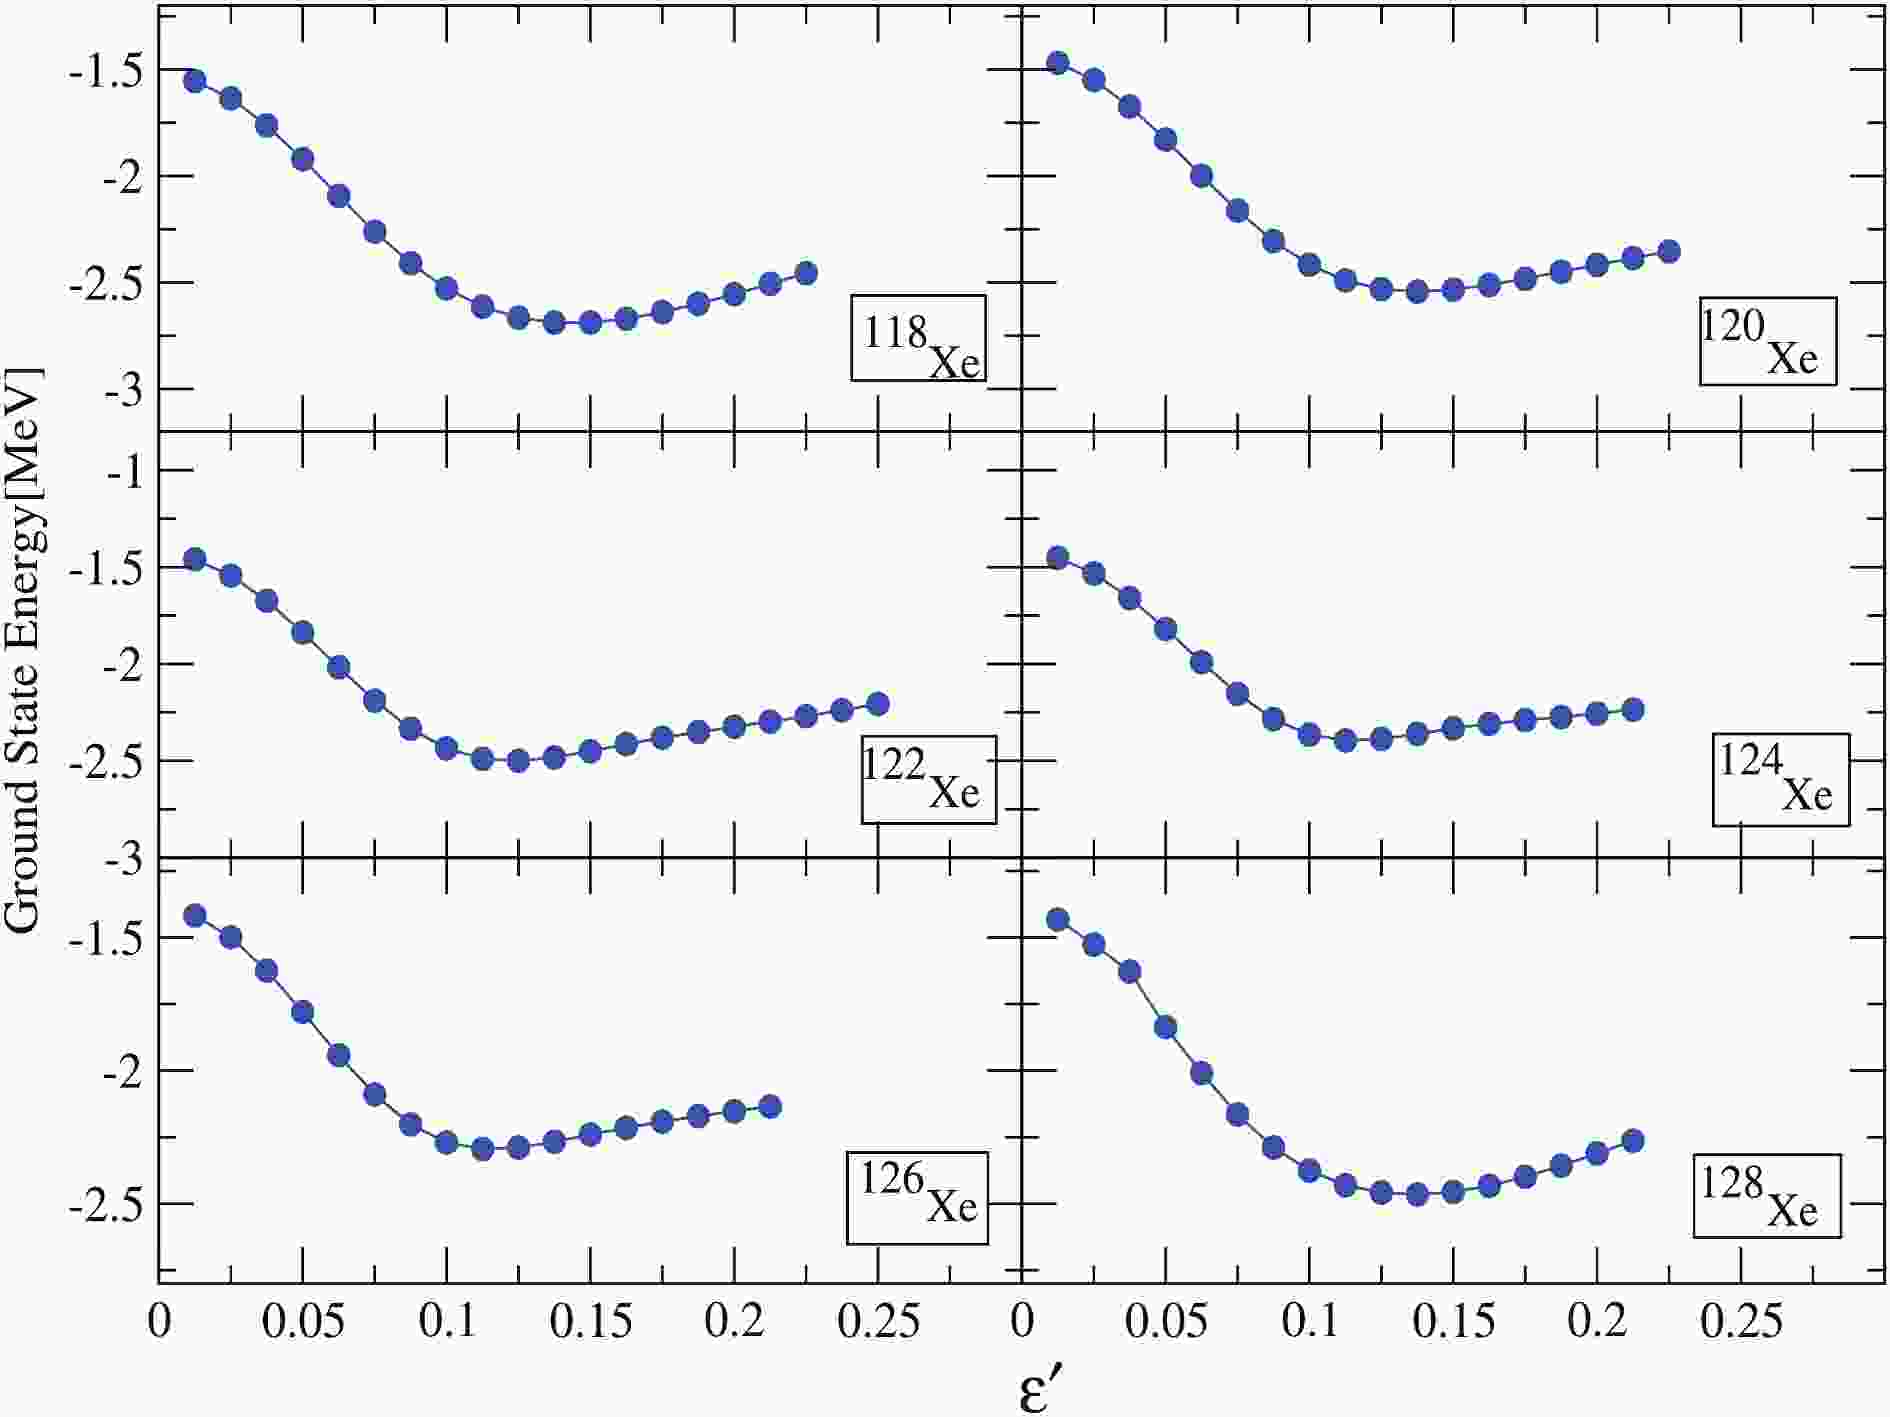
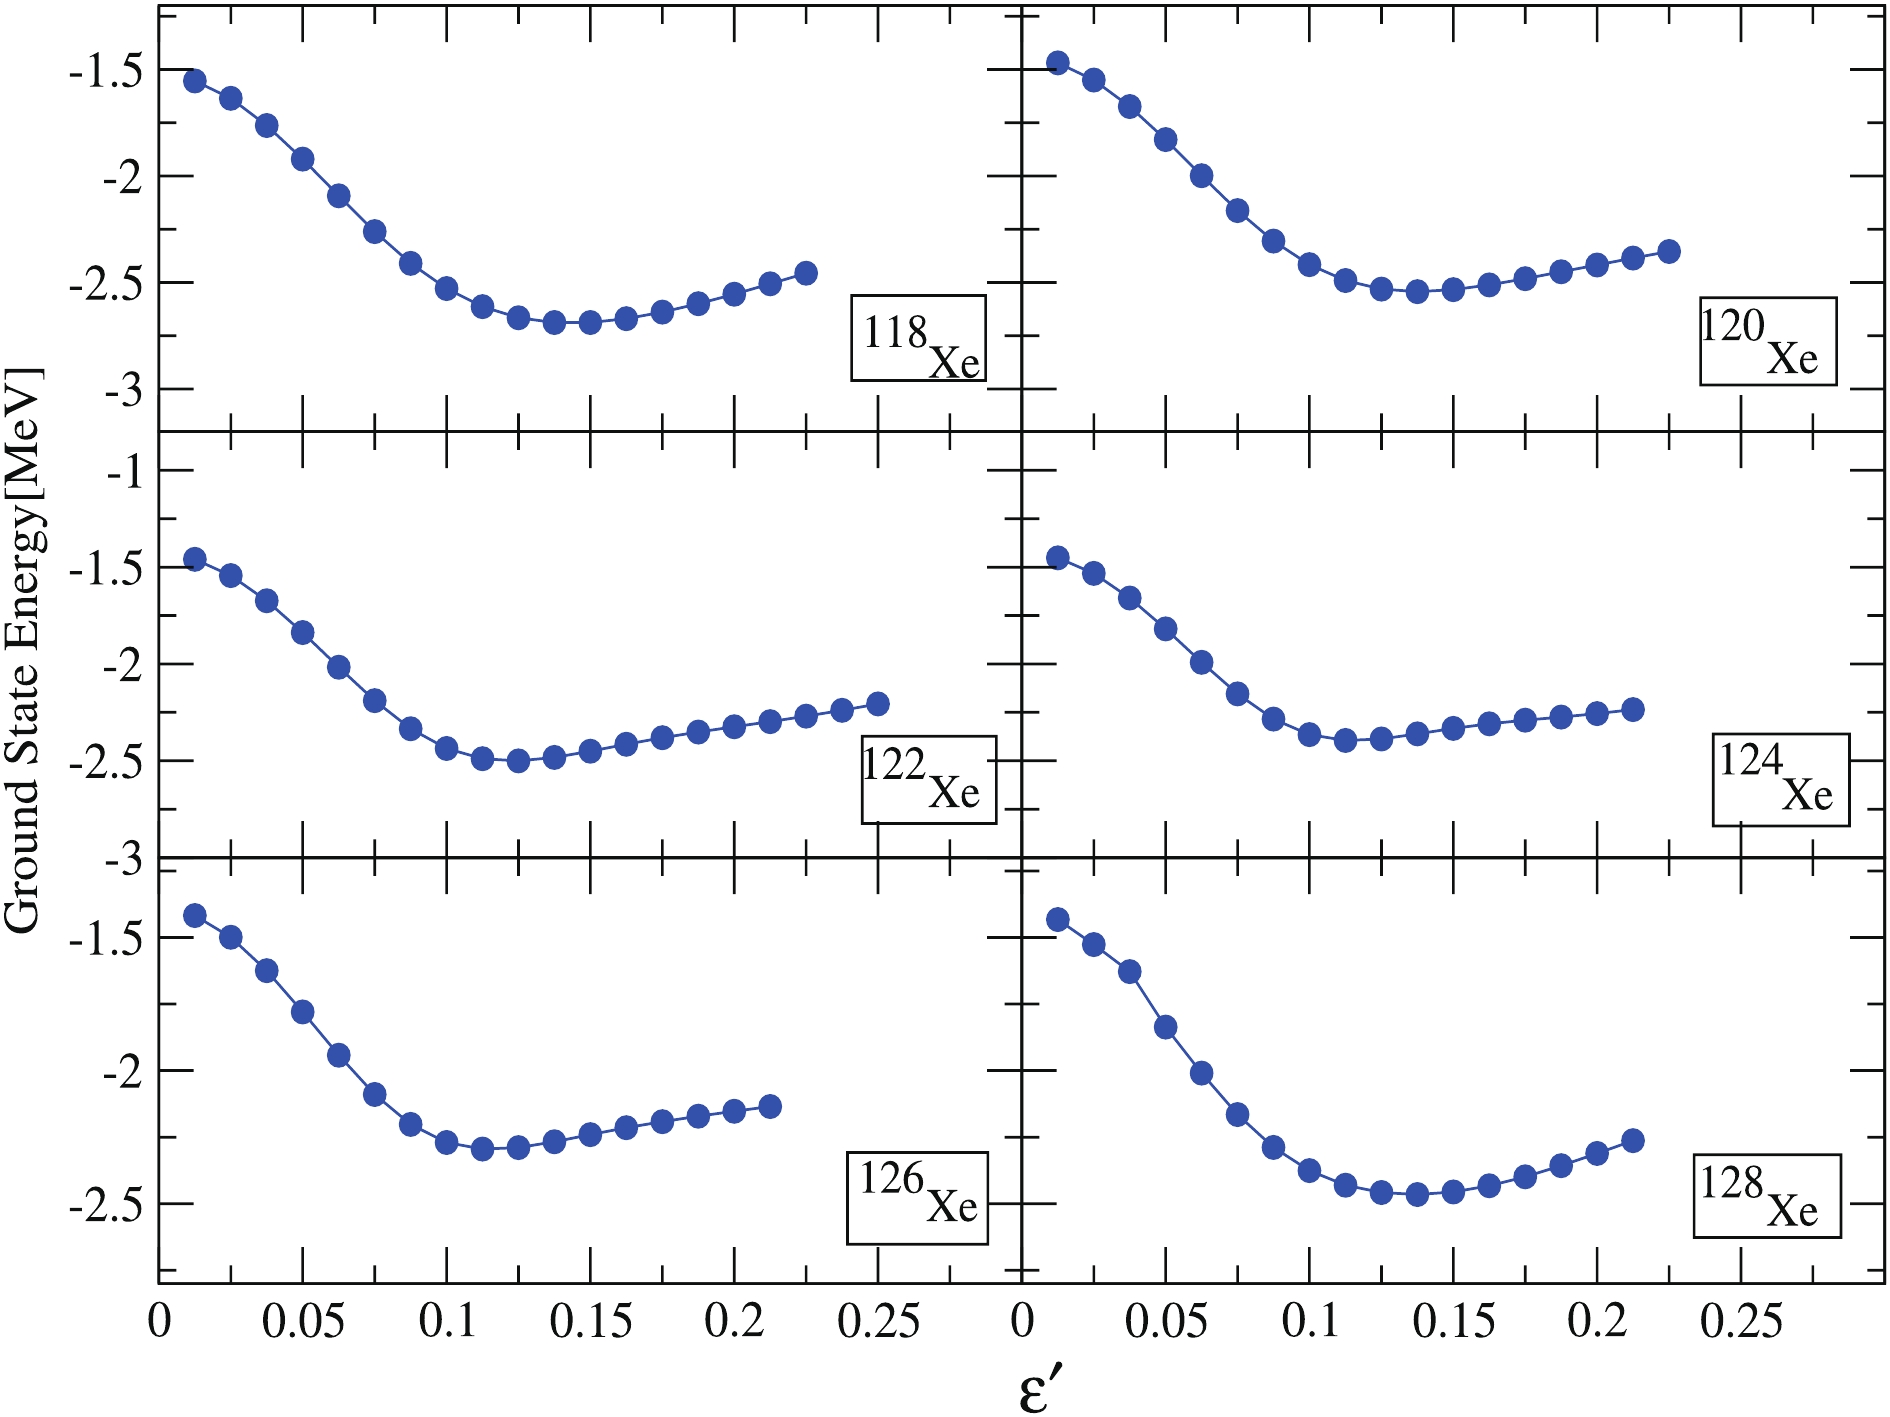
$ ^{118-128} {\rm{Xe}}$ isotopes within the quasiparticle basis space, which is formed by the use of deformation parameters$ \epsilon $ and$ \epsilon' $ (as shown in Table 1). The axial quadrupole deformation parameter$ \epsilon $ has been selected in the present calculations with the aim to reproduce the correct shell filling of the nucleus. The nonaxial deformation parameter,$ \epsilon' $ , is assumed in such a way that the behaviour of the$ \gamma $ -band is properly explained, and its value is in accordance with those obtained from the minimum of the potential energy surface (PES), as shown in Fig. 1. In this figure, the projected ground-state energy is plotted as a function of the triaxial parameter$ \epsilon' $ with the axial deformation parameter$ \epsilon $ held fixed. These deformation parameters are required to solve the triaxial potential that is used to construct the deformed basis states in present calculations. The discussion on calculated TPSM results for$ ^{118-128} {\rm{Xe}}$ isotopes and the comparison to their experimental counterparts on various nuclear structure properties is presented in the following sub-sections. -
The collection of projected energies for various intrinsic configurations leads to the formation of a diagram known as the band diagram. In the present TPSM calculations, these projected energies arise from the diagonal matrix elements used before mixing of the configurations. These band diagrams are known to be quite useful and result oriented, as they play a major role in explaining the underlying intrinsic structures of various bands. Zero-quasiparticle, two-quasiparticle, and four-quasiparticle configurations have been employed for calculating the angular-momentum projected energies with the use of deformation parameters (given in Table 1), and these projected energies are plotted in Figs. 2(a)–(f) for the Xenon isotopes of this study. The projection from the 0-qp configuration provides band structures corresponding to K = 0, 2, 4, denoted as (0, 0), (2, 0), and (4, 0) bands, which relate to the ground,
$ \gamma $ , and$ \gamma\gamma $ band, respectively. These bands are considered to be the main components of the band diagram, as they are responsible for obtaining the lowest energy bands after configuration mixing. It is abundantly clear from the present set of calculations that the projection from the 0-qp state gives rise to the formation of band with only even values of K, i.e, K = 0, 2, 4,... . No odd values of K are obtained here because of the symmetry requirement for the vaccum configuration.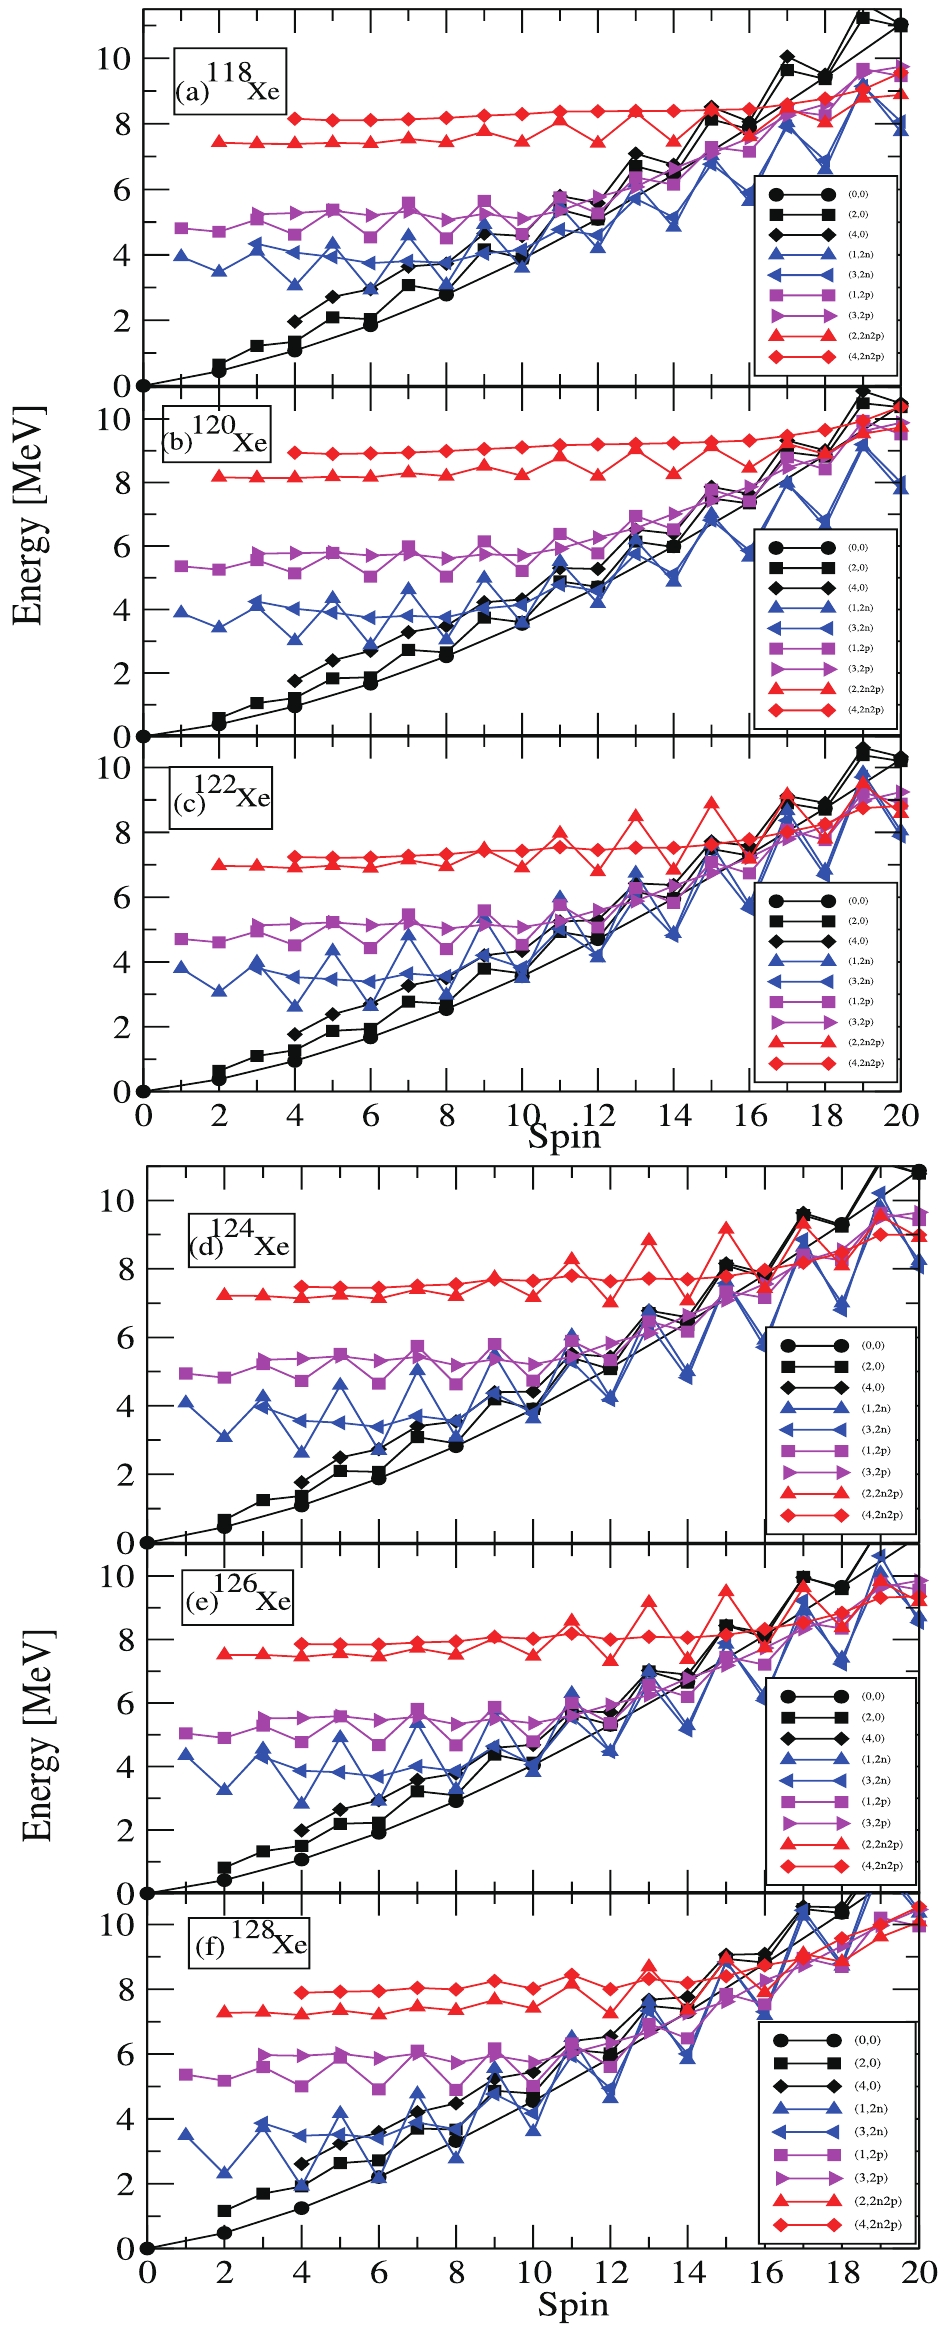
Figure 2. (color online) Band diagrams for 118-128Xe isotopes. Labels (0, 0), (2, 0), (4, 0), (1, 2n), (3, 2n), (1, 2p), (3, 2p), (2, 4), and (4, 4) correspond to ground,
$\gamma$ , 2$\gamma$ , and 2n-aligned$\gamma$ band on this 2n-aligned state, 2p-aligned$\gamma$ band on this proton-aligned state, (2n+2p)-aligned band, and$\gamma$ band built on this four-quasiparticle state.For
$ ^{118} {\rm{Xe}}$ (Fig. 2(a)), the band head energy of the$ \gamma $ -band was obtained at an excitation energy of 0.93 MeV from the ground state band. Here, the two-quasineutron configuration states with K = 1 and 3 cross the ground-state band at I = 10. These bands represent the$ \gamma $ -band built on the two-quasineutron-aligned configurations. The two quasiproton states (1, 2p) and (3, 2p) are closer in energy compared to the two-neutron states, and therefore, cross the ground state band at I = 14. Finally, at I = 16 and above, the 4-qp structures (two-quasineutron plus two-quasiproton) with K = 2 and 4 cross the ground-state band, thereby giving rise to the yrast states that originate from these quasiparticle configurations for at least up to the last calculated spin values shown in the figure. In the case of$ ^{120} {\rm{Xe}}$ in Fig. 2(b), the band head energy of the$ \gamma $ -band is at an energy of 0.85 MeV above the ground state from the present calculation. Notably, the ground state band (0, 0) is crossed by two quasiparticle bands with (1, 2n) and (3, 2n) configurations at I = 12, and is yrast up to this spin value. Further, the two-aligned proton bands with configurations (1, 2p) and (3, 2p) and a 4-qp state (2, 2n2p) band cross the ground state band at I = 18 and decrease in energy until the last calculated spin values.For Fig. 2(c) in
$ ^{122} {\rm{Xe}}$ , the calculated band head energy of the (2, 0) band is about 0.86 MeV from the ground state band (0,0). The ground-state band is crossed by two quasiparticle bands with (1, 2n) and (3, 2n) configurations at I = 10. The figure shows that the two-proton aligned band with (1, 2p) configuration also crosses the ground-state band at I = 14, and from I = 16 the two-quasiparticle proton band (3, 2p) and four-quasiparticle state (2n2p) attain the lowest energy, leading to the formation of yrast. In the band diagram for$ ^{124} {\rm{Xe}}$ , the obtained energy of the band head of the$ \gamma $ -band is at about 0.86 MeV above the the ground state band. The ground-state band with the (0, 0) configuration is crossed at I = 10 by two two-neutron aligned configurations, (1, 2n) and (3, 2n). The two-proton (1, 2p) and (3, 2p) bands decrease in energy and cross the ground band at I = 14. Beyond this spin, it is expected that four-quasiparticle configurations dominate the yrast band along with all the above-mentioned bands.Similarly for
$ ^{126} {\rm{Xe}}$ , the theoretically calculated band head energy of the$ \gamma $ -band is 0.93 MeV above the ground state. The two two-neutron bands (1, 2n) and (3, 2n) cross the ground state band (0, 0) at spin I = 10, and both qp-neutron bands become degenerate in energy. At spin values I = 14 and I = 16, the two 2-qp proton bands and two four-quasiparticle bands, respectively, cross the ground band and decrease in energy, thereby, joining the two 2-qp neutron band and becoming yrast states. Finally, the band diagram for$ ^{128} {\rm{Xe}}$ is also presented in Fig. 2(f),where the calculated band head of the$ \gamma $ -band is at an excitation energy of 1.2 MeV above the ground band. The crossing of the (0, 0) and (2, 0) bands by the two-neutron aligned bands (1, 2n) and (3, 2n), respectively, occurs at I = 8. After spin I = 12 and I = 16, the two-quasiparticle proton bands and four-quasiparticle states (2n2p) attain the lowest energy and become yrast at larger values of angular momentum. -
Our next aim is to obtain the energies of states obtained after configuration mixing. To this end, the shell model Hamiltonian of Eq. (3) is diagonalized with the obtained projected energies, giving rise to the energies of the states known as yrast states. The energies of the yrast states for
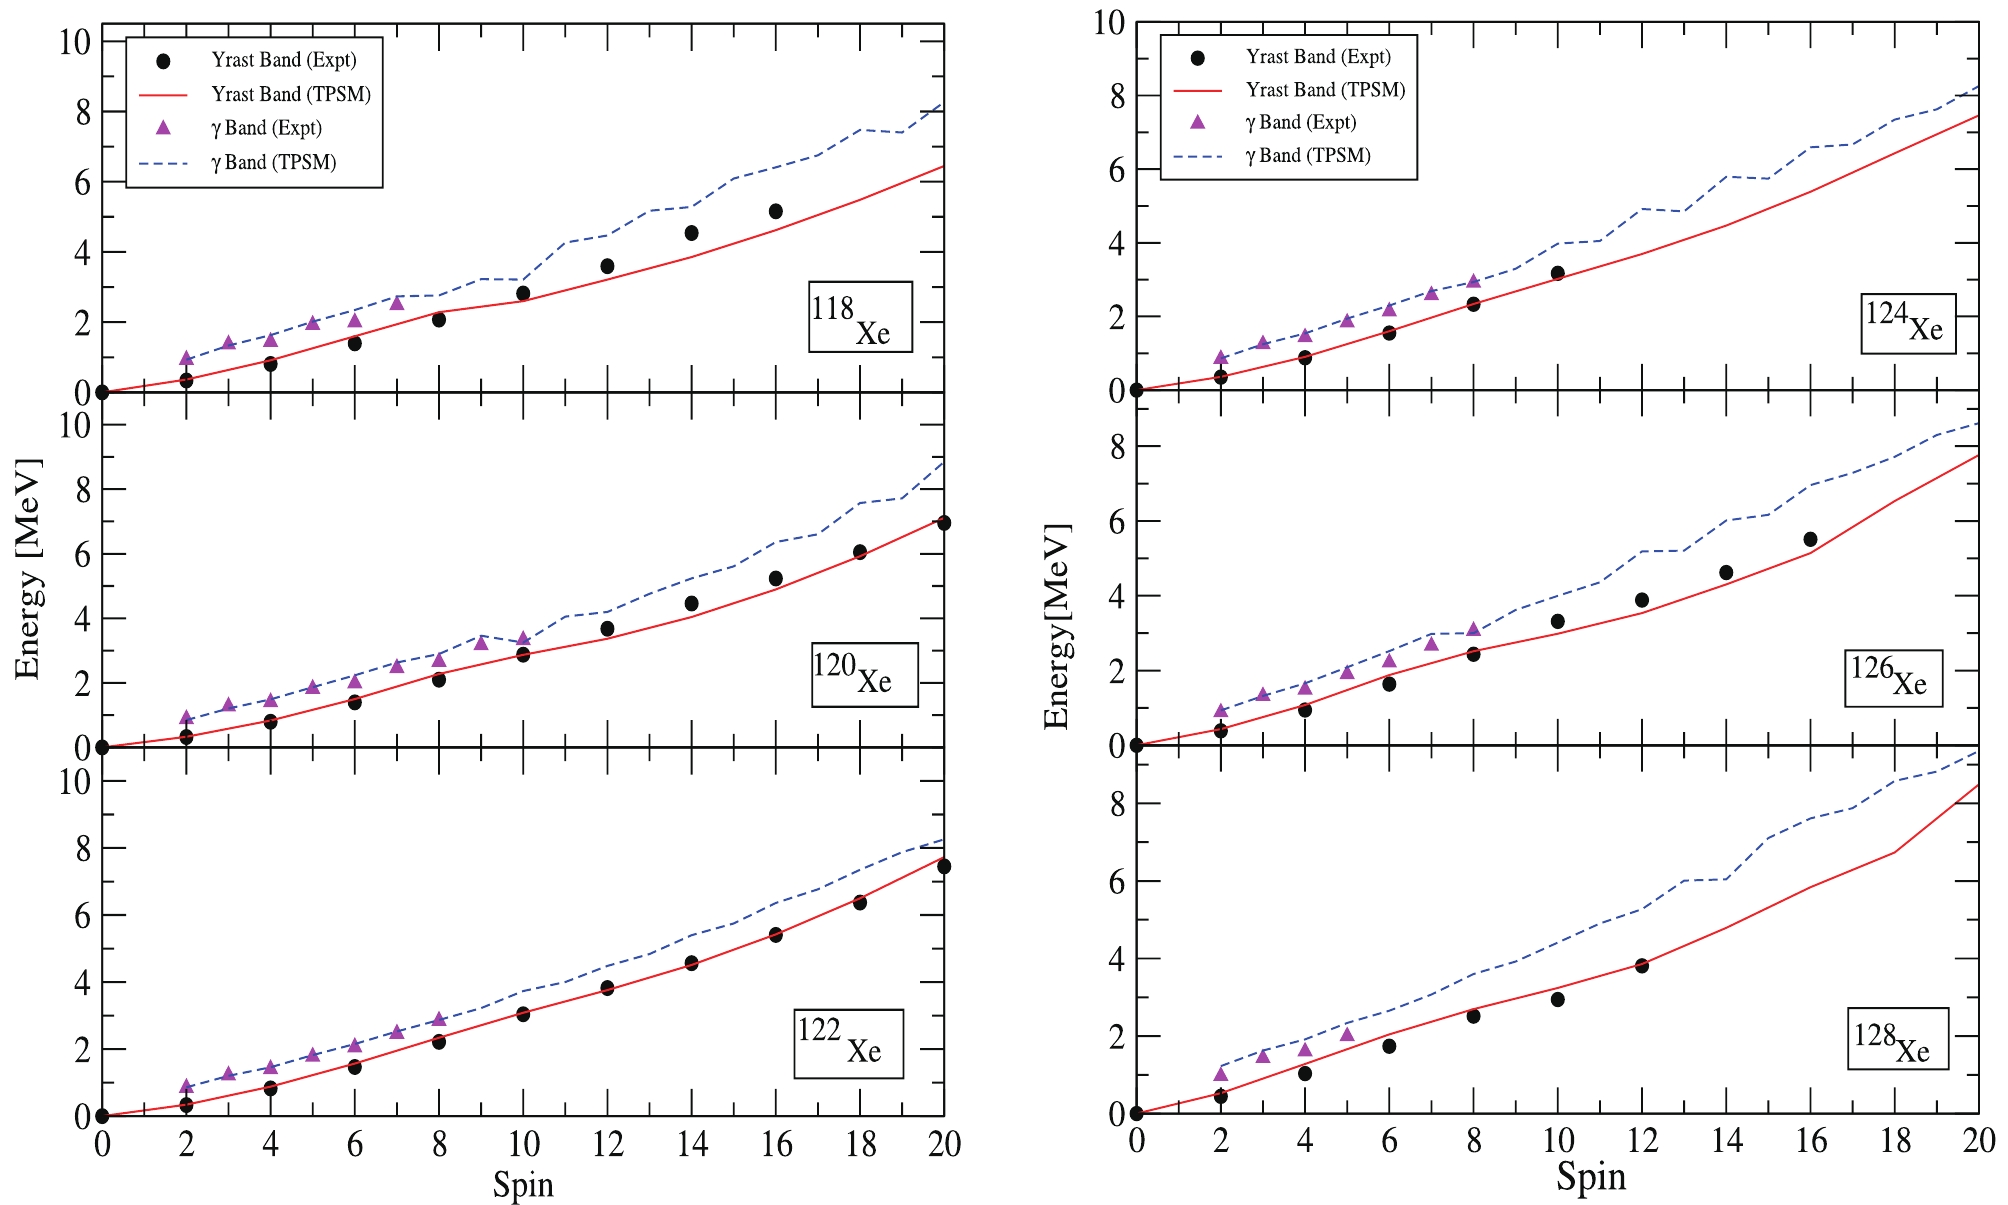
$ ^{118-128} {\rm{Xe}}$ are presented in Fig. 3 in comparison with the experimental data [37–42]. For the purpose of discussion in terms of the relevant physics, only the lowest three bands from the 0-qp configuration and the lowest two bands for other configurations are shown in the band diagrams. However, during the diagonalization of the Hamiltonian, the basis states employed are more numerous, which includes, for example, those with K = 1, 3, 5, and 7 with$ \kappa $ = 1 and K = 0, 2, 4, 6, and 8 with$ \kappa $ = 0, where the index$ \kappa $ indicates the basis states. The lowest three bands, obtained after diagonalization for each angular momentum, that only contribute to the formation of yrast energies, are shown in Fig. 3 for all studied Xe isotopes. From the figure, the agreement between the TPSM and experimental energies for the yrast and$ \gamma $ -bands is excellent for all the chosen$ ^{118-128} {\rm{Xe}}$ isotopes. The calculated spectra for these isotopes are well fitted to experimental data for low as well as high-spin states. The predicted$ \gamma $ -bands are calculated for the spins higher than the available experimental data, and we hope that future high-spin experimental studies are able to populate these bands. -
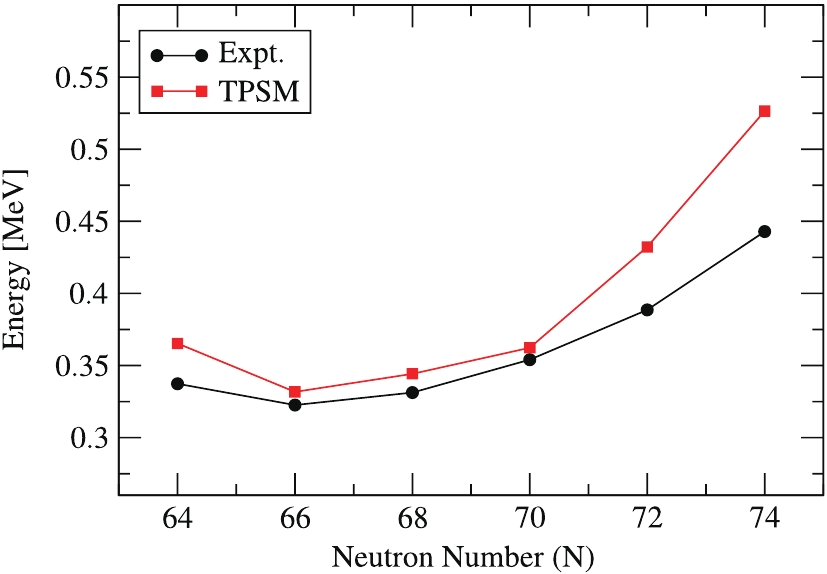
From the experimental point of view, the evolution of nuclear structure of the Xe isotopes with A = 118 to 128 can be inferred from Fig. 4, where the variation of
$ [E(2_{1}^{+})] $ is shown with respect to neutron numbers. Fig. 4 shows that the energy of the first-excited state$ [E(2_{1}^{+})] $ is at its minimum for N = 66 (for$ ^{120} {\rm{Xe}}$ ) and then rises smoothly from N = 68 to N = 74. Both the experimental and calculated results follow the same trend, indicating satisfactory agreement for$ [E(2_{1}^{+})] $ . Moreover, a dip in energy$ [E(2_{1}^{+})] $ is clearly observable for$ ^{120} {\rm{Xe}}$ , and as per Grodzin's rule [22], this isotope$ ^{120} {\rm{Xe}}$ can be considered to be the most deformed among all other studied isotopes because of the inverse variation of$ [E(2_{1}^{+})] $ with the quadrupole moment ($ \epsilon_2 $ ). Further, the experimental and calculated energy ratios$ R_{4/2} $ =$ [E(4_{1}^{+})/E(2_{1}^{+})] $ with neutron numbers are presented in Table 2. Casten et al. [43] showed that for even-even nuclei, the shape phase transition is associated with a sudden change in nuclear collective behaviour, as a result of which the ratio$ R_{4/2} $ =$ [E(4_{1}^{+})/E(2_{1}^{+})] $ suddenly increases from the spherical value of 2.0 to the deformed$ \gamma $ -soft nuclei value of 2.5, and the maximum value of 3.33 for an ideally symmetric rotor. Table 2 indicates that the comparison of observed energy ratios with experimental data is quite satisfactory, and the experimental$ R_{4/2} $ ratios for the$ ^{118-128} {\rm{Xe}}$ isotopes lie between 2.33 and 2.5. These theoretical values suggest that the values of$ R_{4/2} $ increase gradually from 2.4 to 2.5 with the increase in mass number A = 118 to 122, and then decreases from 2.5 to 2.33 on moving towards$ ^{128} {\rm{Xe}}$ , indicating the presence of$ \gamma $ -soft shapes in these nuclei. This confirms the triaxial nature of the chosen Xenon isotopes in the present study. Further, the heavier Xe isotopes beyond$ ^{122} {\rm{Xe}}$ are less deformed than the lighter ones.The ratio attains its maximum value in$ ^{122} {\rm{Xe}}$ near$ ^{120} {\rm{Xe}}$ , indicating nuclei with a large deformation and more rotational properties.Xe $R_{4/2}$ =

$[E(4_{1}^{+})/E(2_{1}^{+})]$ 

Expt. TPSM 118 2.4 2.5 120 2.46 2.51 122 2.5 2.53 124 2.48 2.49 126 2.42 2.48 128 2.33 2.42 Table 2. Comparison of observed energy ratios of energies of first two excited states
$R_{4/2}$ =$[E(4_{1}^{+})/E(2_{1}^{+})]$ with experimental data. -
The nature of triaxial shapes in all chosen
$ ^{118-128} {\rm{Xe}}$ isotopes can be interpreted in terms of the staggering parameter, defined as$ S(I) = \frac{[E(I)-E(I-2)]-[E(I-1)-E(I-2)]}{E(2_{1}^{+})} , $

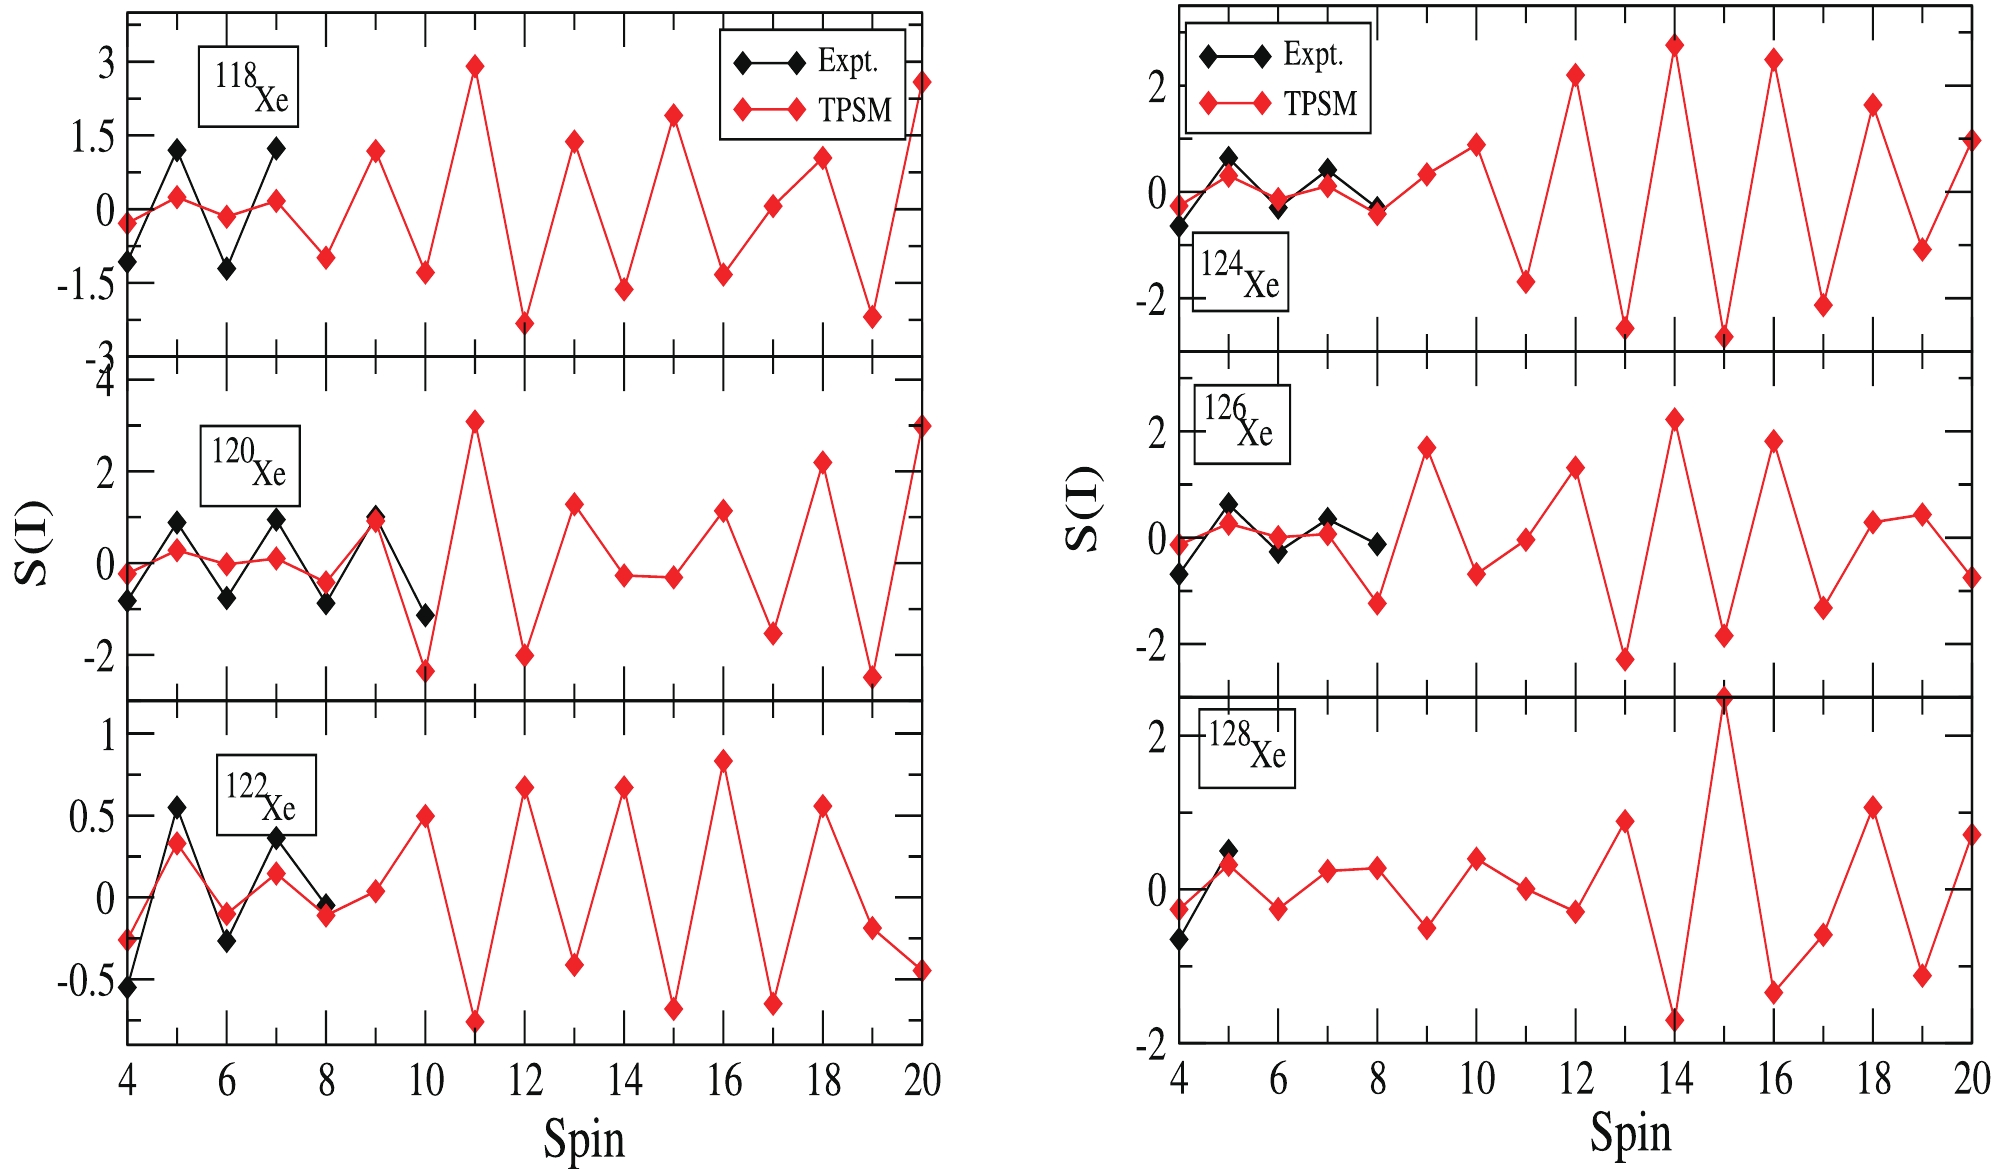
(7) S(I) is plotted for the
$ \gamma $ -bands in Fig. 5. The attempt has been made in the present study to describe the odd-even staggering in the$ \gamma $ -bands obtained after configuration mixing of the studied Xe isotopes. Fig. 5 shows that the experimental staggering parameter for the known energy levels is reproduced quite accurately by the TPSM calculations, except for$ ^{118,120} {\rm Xe}$ . Furthermore, the staggering S(I) is quite small at lower spins. This is attributed to the fixed deformation parameters used in the calculations, and shape fluctuations are not taken into account. Above I = 8, the staggering increases for almost all isotopes under consideration, which might be due to the crossing of the two-quasineutron-aligned band with$ \gamma $ -bands (2, 0) at this spin value (as noted from the earlier discussion presented in Section 3.1 for band diagrams). In particular, all studied Xe isotopes can be considered to possess the same staggering phase in S(I). However, the results obtained are particularly interesting after a full mixing of quasiparticle configurations at spin values$ I\approx14-18 $ for$ ^{118-128} {\rm{Xe}}$ , where an inversion in the staggering pattern is observed. A study by R. Bengtsson et al. [44] proposed that the signature inversion, i.e., exchange of energetically favored and unfavored spins, might be evidence for a triaxial shape in those nuclei. Thus, the presence of inversion in the staggering pattern of the$ ^{118-128} {\rm{Xe}}$ isotopes also provides an important indication of the triaxiality in the chosen nuclei. -
The essential process of the backbending phenomena [45] is considered as a quasiparticle level crossing between an vacant high-j intruder orbital and the most high-lying populated orbital, resulting in a sudden increase of the moment of inertia along the yrast level and decrease in the rotational frequency. K. Higashiyama et al. [45] have likewise successfully demonstrated the shell model description of the backbending phenomena in Xe isotopes in the
$ A\sim130 $ region. In Fig. 6, the results of moment of inertia$ J^{(1)} $ and the square of the rotational frequency$ \omega^2 $ are plotted for nuclei$ ^{118-128} {\rm{Xe}}$ , where$ J^{(1)} $ and$ \omega^2 $ are defined as follows: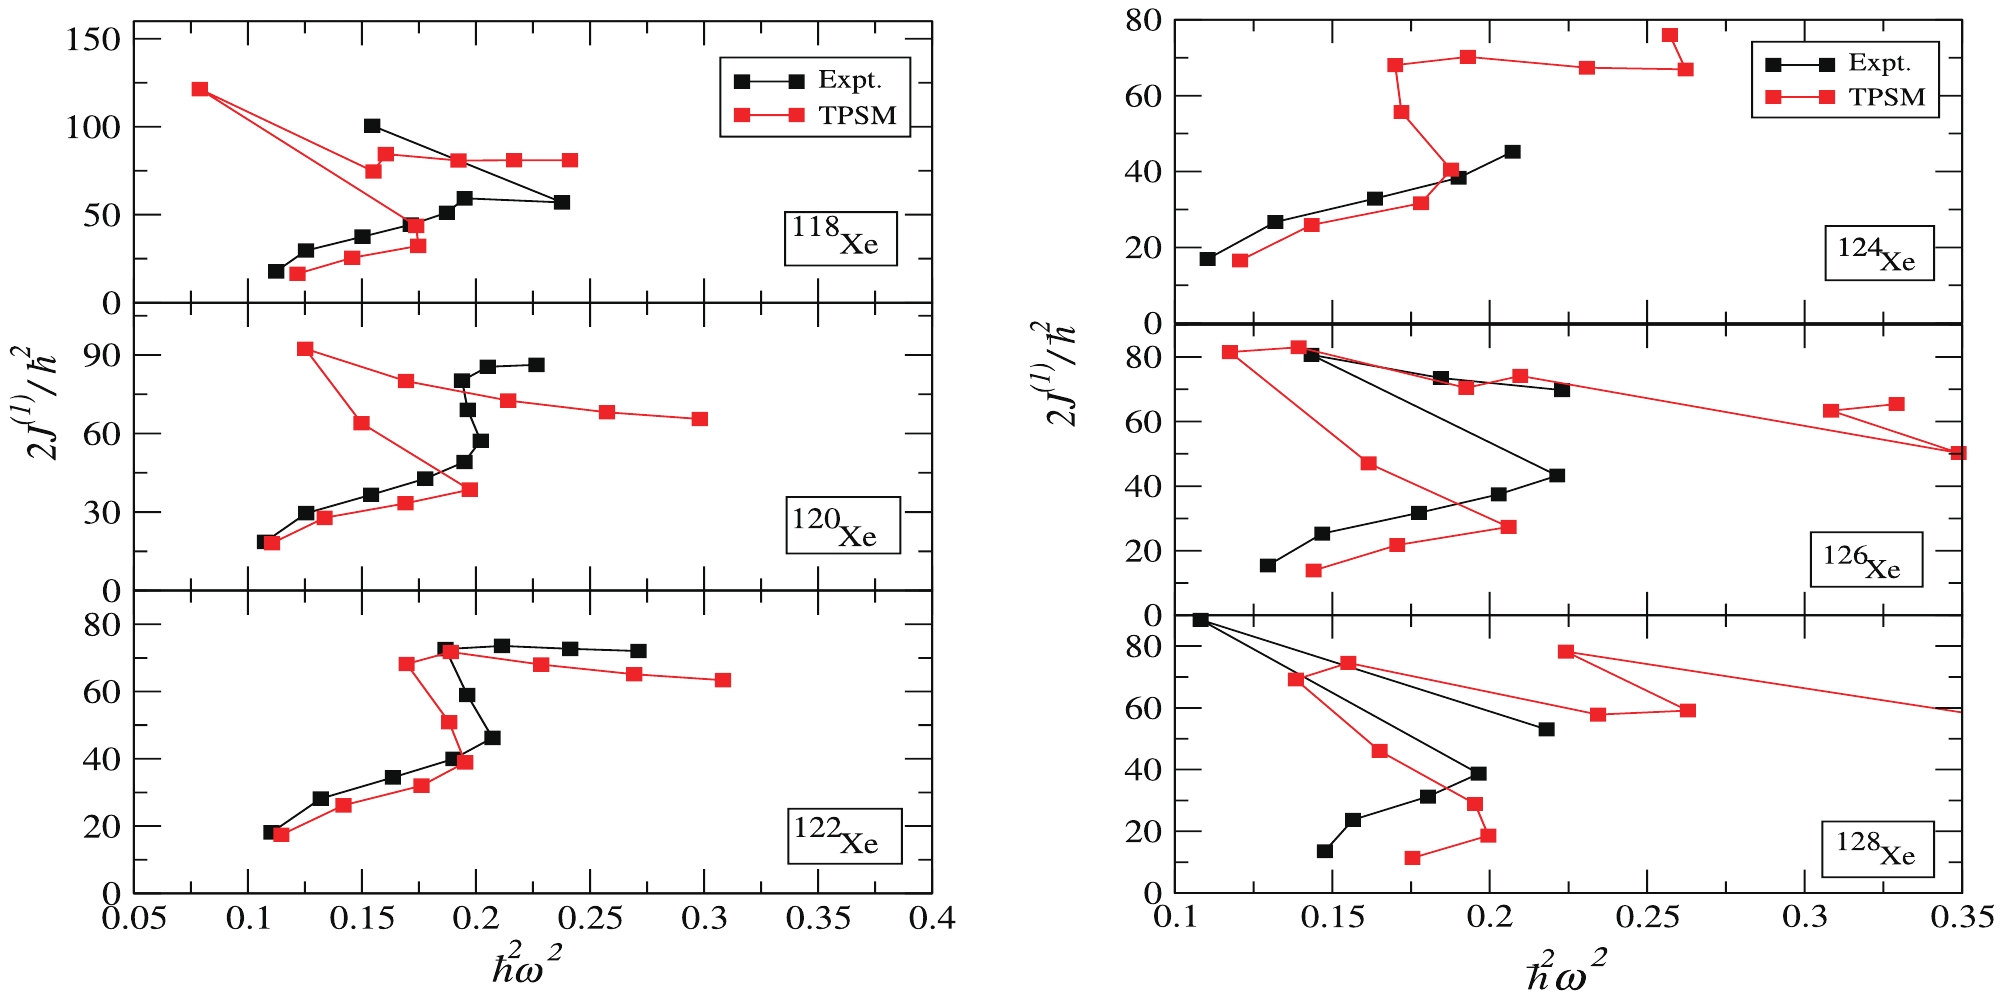
Figure 6. (color online) Plots of kinematic moment of inertia
$(2J^{(1)}/\hbar^2)$ as a function of$(\hbar\omega)^2$ for$^{118-128}{\rm{Xe}}$ .$ 2J^{(1)}/\hbar^2 = \frac{4I-2}{E_{I}-E_{I-2}} , $

(8) $ \hbar^2\omega^2 = \frac{(I^2-I+1)(E_{I}-E_{I-2})}{(2I-1)^2} . $

(9) The sudden drop in the value of rotational frequency of the yrast band at the band crossing is well reproduced for the even-even
$ ^{118-128} {\rm{Xe}}$ isotopes. Fig. 6 clearly shows that for the low spin region, the g-band is the dominant band in all$ ^{118-128} {\rm{Xe}}$ isotopes, and the slope of calculated backbend at$ I\approx8-12 $ is more prominent than that of the experimental backbend, where the first 2-qp band crossing takes place for all isotopes under study. For$ ^{118} {\rm{Xe}}$ , the first backbend is obtained at spin I = 10, which is the same spin value of the first band crossing. This occurs because the rotational frequency of the yrast band decreases suddenly at a band crossing and thus leads to the S-shaped (backbending) diagram. However, the experimental backbend occurs at spin I = 16. Similarly for$ ^{120} {\rm{Xe}}$ , the calculated backbend is obtained at spin I = 10; however, no experimental backbend is observed as the data at high spins is inadequate. Furthermore for$ ^{122} {\rm{Xe}}$ , the calculated and experimental backbends take place at spin I = 10, where the first band crossing is also reported in the band diagram for$ ^{122} {\rm{Xe}}$ . Further, for$ ^{124} {\rm{Xe}}$ , the calculated backbend is obtained at spin I = 10. However, due to the lack of experimental data at high spins, its accuracy cannot be guaranteed. For$ ^{126} {\rm{Xe}}$ , the successive band crossings take place in succession as the spin increases at spin values I = 8, 10. In contrast, the experimental backbend is obtained at I = 12. Finally, for$ ^{128} {\rm{Xe}}$ , the first calculated backbend is obtained at I = 8, whereas the experimental observed backbend is at I = 10. The backbending phenomena in these isotopes are, thus, considered to be caused by the crossing of the two-quasi-particle neutron bands and the ground-state band. At higher spins, the two quasi-proton aligned state is favourable in energy and crosses the g-band in all Xenon isotopes in the present study. One of the most critical factors for the sharpness of the backbend is the crossing angle of the g-band and other multi-quasi particle bands at the crossing spin. Finally, we conclude that the two 2-qp neutron aligned bands, which crossed the g-band at the (first) band crossing, remain as yrast bands until they are crossed by other 2-qp and 4-qp bands (usually a$ 2\nu\otimes2\pi $ 4-qp band). The agreement between theory and experiment for backbendng is well reproduced for some, but not all of the isotopes under study. These results may improve with the inclusion of higher quasiparticle states in the present applied model. The theoretical calculations and analyses show that the backbending phenomenon may be the result of the crossing of the ground-state band and the band with two-quasi-neutrons in all Xenon isotopes. -
Another part of the present TPSM calculations involves the study of the electric quadrupole transition probabilities B(E2). In this study, B(E2) values are calculated according to the following procedure. The projected states thus obtained are employed as new basis states for diagonalization of the shell model Hamiltonian in the TPSM basis. Then, with the help of the diagonalized Hamiltonian, eigenfunctions are obtained, which are used to calculate the electric quadrupole transition probabilities as follows:
$ B(E2: (I_i, K_i)\rightarrow (I_f, K_f)) = \frac 1{2I_i+1}\left| \left\langle \Psi^{K_f}_{I_f} || \hat Q_2 || \Psi^{K_i}_{I_i} \right\rangle \right| ^2 , $

joining initial state
$ (I_{i}, K_{i}) $ and final states$ (I_{f}, K_{f}) $ . In the present set of calculations for B(E2), the proton and neutron effective charges are denoted by$ e_{\pi} $ and$ e_{\nu} $ , respectively, which are defined through the relations as$ e_{\pi} = 1+e_{\rm eff} $ and$ e_{\nu} = e_{\rm eff} $ . In the present set of calculations, the value of$ e_{\rm eff} $ is taken as 0.5. In Fig. 7, the calculated B(E2) transition probabilities along the yrast band are compared with known experimental values [46, 47] and HFB results [46]. The transition probabilities are efficiently reproduced by present TPSM calculations. In particular, the increasing trend of B(E2) for high-spin states are well described by TPSM calculations, and the observed drop in the B(E2) transitions with spin is likewise correctly reproduced, except for$ ^{118} {\rm {Xe}}$ . Furthermore, the B(E2) values for$ ^{120} {\rm {Xe}}$ are excellent, and this can be attributed to the presence of mid shell neutrons, N = 66, where the the number of active neutrons and hence the neutron-proton correlations are at their maximum. The transition probabilities in the band-crossing region are clearly reduced, as these values of B(E2) are evaluated between the predominant ground state and two-quasiparticle aligned configurations. The decrease in B(E2) values is related to the crossing of the two-quasiparticle neutron configuration with the ground-state band. Thus, the known experimental values and the calculated B(E2) values are efficiently reproduced by the present study.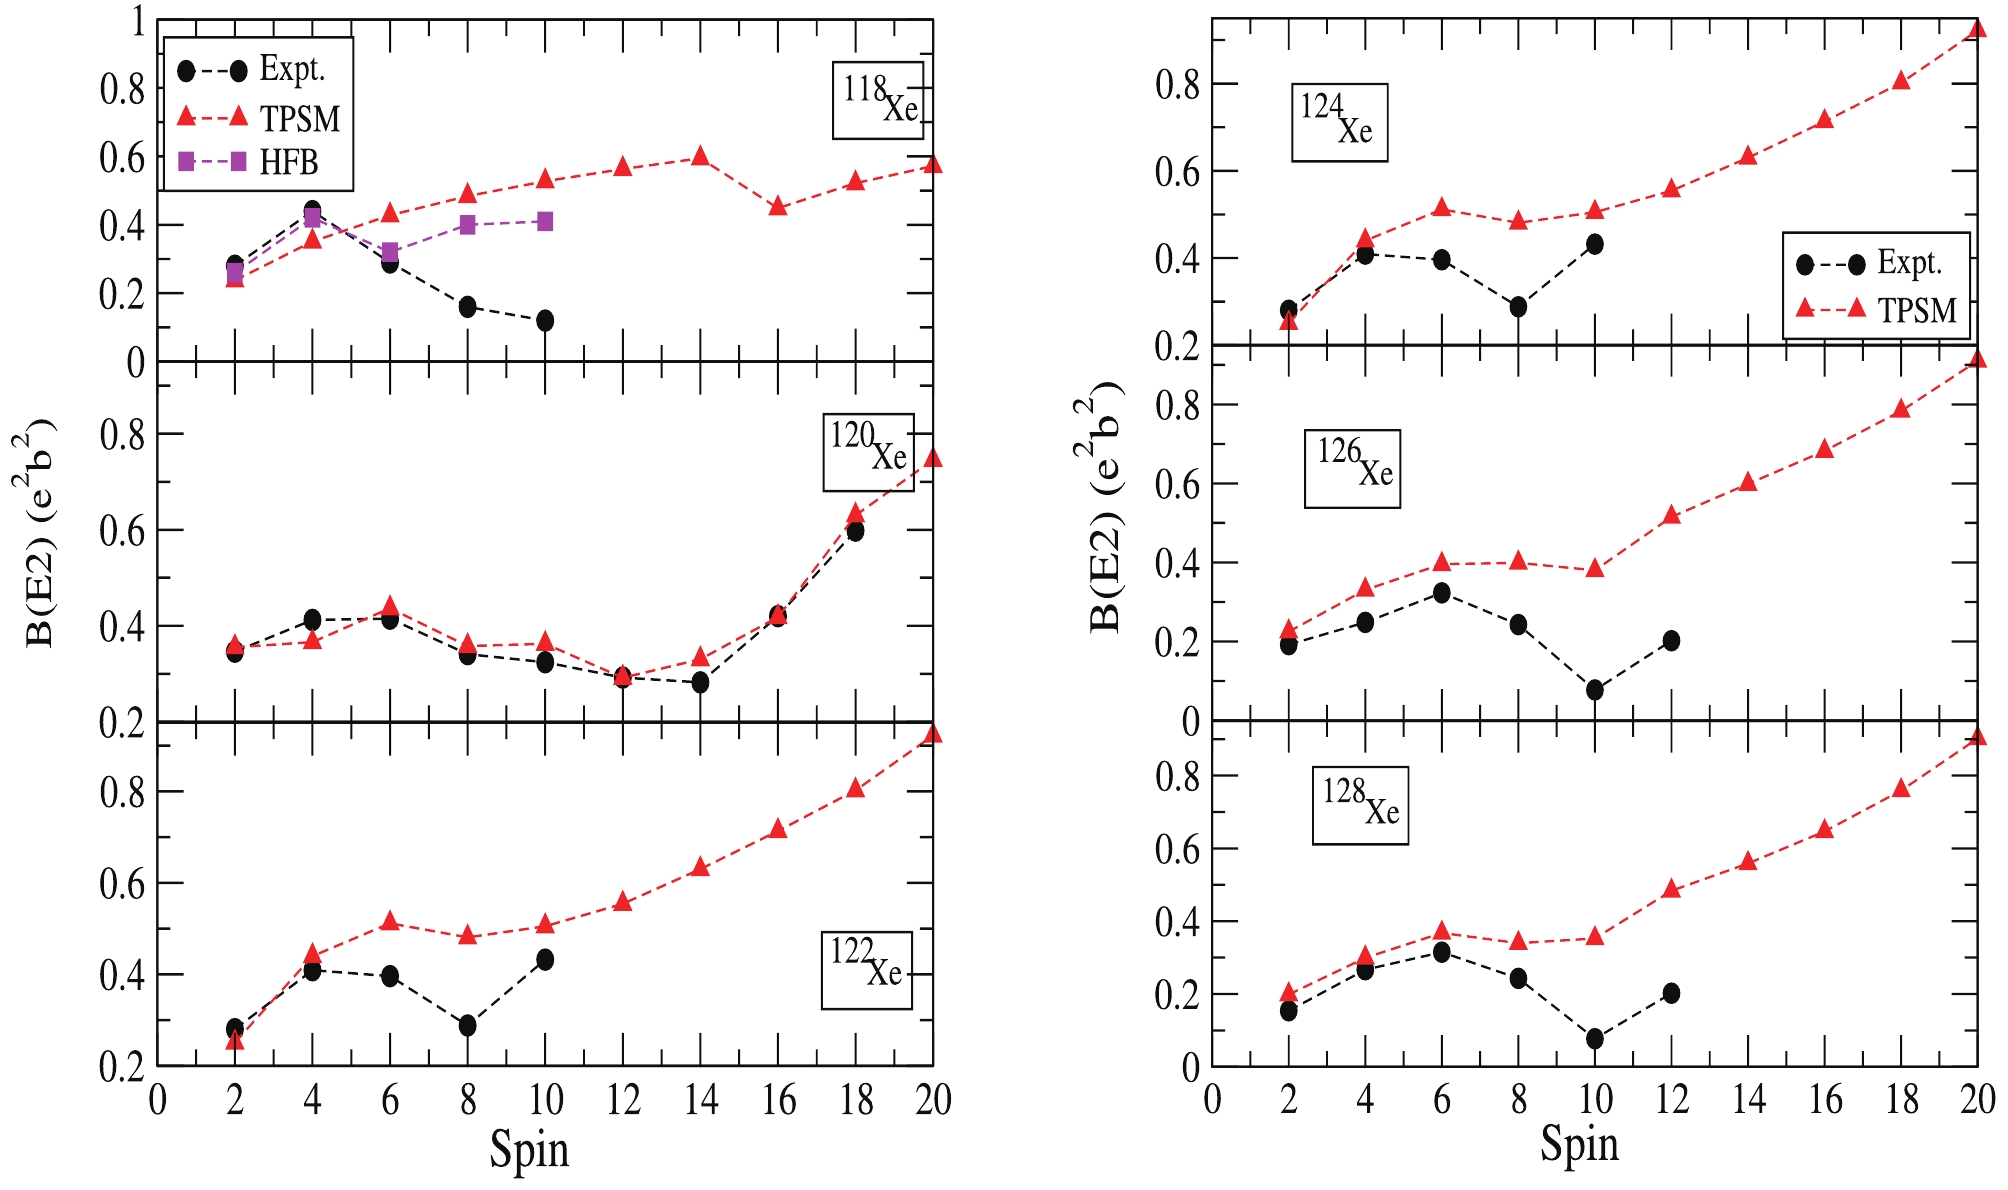
Figure 7. (color online) Comparison of calculated (TPSM) B(E2) values with experimental (Expt.) and other HFB ([46]) data in
$ ^{118-128}{\rm{Xe}}$ . -
The ongoing discussion regarding calculated results and their comparison with the existing experimental data led to various important interpretations for Xenon isotopes
$ ^{118-128} {\rm{Xe}}$ within the applied quantum mechanical framework, i.e., triaxial projected shell model. The following inferences are drawn from the present study.The TPSM approach with an extended basis was adopted in the present work to investigate the ground state and gamma bands of even-even
$ ^{118-128} {\rm{Xe}}$ isotopes, which were efficiently reproduced by the method. The calculated spectra for the yrast and$ \gamma $ -band provided an excellent fit to experimental data for low-spin states as well as high-lying states for all isotopes. Moreover, the bandhead of the yrast band for all isotopes is likewise well reproduced. The chosen qp basis states in the present study are appropriate for describing high-spin states properties of Xenon isotopes.To obtain information about the nuclear structure and evolution of the chosen Xe isotopic chain, the comparison of the experimental energy ratios with the calculated data was carried out, and the agreement between the two is well reproduced. Furthermore, the energy ratios clearly indicate the presence of
$ \gamma $ -soft shapes in studied Xe isotopes. The calculations presented in the present study provide evidence for triaxiality in the chosen Xe isotopes.The odd-even staggering phase of the
$ \gamma $ -band is well reproduced, and the staggering magnitude increases towards higher spins. This increase in S(I) is related to the importance of the two-neutron aligned configuration above I = 8, and it is also evident from the band diagrams.The relationship between backbending at a particular spin with the crossing of the band at the corresponding spin is efficiently described by the approach employed in this study. The results clearly show that the decrease in the moment of inertia immediately after the first band crossing takes place for all
$ ^{118-128} {\rm{Xe}}$ isotopes as a result of the rotational alignment of the 2qp neutron state, and the amount of spin alignment is given by the spin value at which the band energy assumes its the minimum value after crossing. Thus, this phenomenon of backbending conveys important information on the interplay between the ground band and bands with alignment of a pair of 2qp neutron quasiparticles.The present TPSM approach provides an accurate description of the measured B(E2) for all isotopes chosen for this study. In the high-spin region, the drop in the transitions is attributed to the rotational alignment of neutrons.
Thus, the present study clearly demonstrates that a model based on systematic pairing and quadrupole-quadrupole interaction, with the incorporation of three-dimensional angular-momentum projection, efficiently describes near yrast band structures and various other nuclear structure properties in the studied transitional nuclei.
The authors of the present paper express their gratitude to Prof. Y. Sun and K. Hara for their collaborations.
Evolution of intrinsic nuclear structure in medium mass even-even Xenon isotopes from a microscopic perspective
- Received Date: 2020-01-29
- Available Online: 2020-07-01
Abstract: In this study, the multi-quasiparticle triaxial projected shell model (TPSM) is applied to investigate


 Abstract
 HTML
HTML Reference
 Related
 PDF
PDF






 DownLoad: